This post was originally published in French only. We translated it in 2026 so the archive reads the same in both languages. Read the original →
June takes on a special flavour this year on the Hackfest blog: four articles on assembly programming will be published, one each week, and the month will be capped off with a HackerSpace presentation on the topic. Hopefully you'll learn something! Here is the second article in this series. The articles for week 1 and week 3 are also available.
Last week recap
Last week, we talked about the various x86 processor registers and what each of them is used for. We also discussed memory and the basics of how it works. Those who don't remember these concepts are strongly encouraged to go back and read the previous article before diving into this one.
This week
This week, we'll talk about the basic structure of applications. On top of that structure, we'll start looking at how to use assembly language and a debugger so we can see our applications actually working. By the end of this article, you will have written your first assembly application, and you will also have debugged and run it (although it won't display anything...).
Structure of a program
The assembly projects we'll build will all follow the same structure. The .s files (the file extension used for asm source code) we create will all be divided into several sections. These sections tell the compiler about the nature of the data found inside a given section. The following figure shows an example assembly project template you could use to follow along with the examples we'll be coding.
File template.s
|
/* Modèle de projet ASM */ .section .data #Les variables initialisées viennent ici .section .rodata #Les variables initialisées ici sont en lecture seule .section .bss #Les variables non initialisées viennent ici .section .text #Le code vient dans la section text .globl _start #Le label _start est disponible globalement (à l’extérieur du binaire) _start: #Label _start, le code qui suit sera exécuté, c’est notre point d’entrée #LE CODE VIENT ICI |
Reading the template.s file shown in the previous figure, you can see that it mainly contains four sections. Each of these sections has a very specific purpose. Note, in passing, the use of /* */ and # to mark comments.
The first section, .data, is the section where our application's global variables are declared and initialized. Variables declared in this section are available to the programmer for both reading and writing.
The second section, .rodata, is similar to the first, except that the variables declared and initialized in this section are read-only. Any attempt to modify this data will trigger a “segmentation fault”.
The third section, .bss, is also similar to the .data section, except that the variables declared in this section are not initialized at declaration time. So the programmer will have to initialize these variables to the right values before using them. In short, the .bss section is mostly used to “reserve” memory space that will be used while the application runs.
The last section we'll talk about is the .text section. This is the section that contains the application's code. It's in this section that the assembly instructions are written so they can be executed by your workstation's processor. You can even see that some elements are already present in this section. The first instruction in the section, the .globl _start instruction, makes the _start label accessible to the “linker” (more on that later). Roughly speaking, this simply means that the code under the label could be used by other applications. The second instruction, _start:, just marks the presence of a label. Again, roughly speaking, you can compare such a label to a function or procedure declaration. But careful, that's still a very “rough” way of putting it... The code following the _start label will be executed when execution of the _start label is requested. Speaking of this label, its name matters. The _start label is the entry point of your application. It's a bit like the int main() function in C programming.
First assembly application
So it's time to dive into our first assembly application. This application is fairly simple and doesn't display anything. The point of this little project is mainly to go through all the steps of building the application and to learn the basics of gdb (the GNU debugger). This project also lets us get familiar with some concepts that will stay with us throughout the whole series of articles. Our first project will therefore have only two sections, the .data section and the .text section.
The code in the .data section is pretty simple. The following figure shows the implementation of this section's code for this exercise.
|
.section .data nbPommes: .int 255 |
As you can see, apart from the declaration of the section itself, this section has only two lines of code. The first one, the nbPommes: label, is used to give a name to the memory area declared on the next line. Note the use of the term “memory area”. You need to know that in assembly, everything (or almost) is just a pointer, so a good understanding of pointer concepts is important. This article is also meant as a little refresher on the subject. The next line, .int 255, lets us “type” our memory area and assign it a value. In our case, the memory area will be an integer whose value is the decimal number 255. These two lines could therefore be translated as:
int nbPommes = 255;
If we were using the C language.
The .text section, for its part, will contain a bit more code. The following figure shows the code for this section
|
.section .text #Le code vient dans la section text .globl _start #Le label start sera disponible pour le linker _start: #Label _start, le code qui suit sera exécuté movl $nbPommes, %eax addl $50, (%eax) incl (%eax) #fin de l'application #c'est un peu l'équivalent du #return 0 à la fin de #la fonction main() en C #Nous reviendrons sur ce genre d'appel #dans un prochain article movl $1, %eax movl $0, %ebx int $0x80 |
First of all, you should know that the last three lines of code at the end of the application don't concern us for now. We'll come back to them in an upcoming article. However, if you're curious, you can do a quick Google search for “Linux system calls”. You'll find answers to your questions there. So, in reality, for now only three lines of code interest us, namely the lines:
|
movl $nbPommes, %eax addl $50, (%eax) incl (%eax) |
The first instruction used, movl, moves a 32-bit piece of data from a source to a target. In this case, the source is the memory address of our nbPomme variable, declared and initialized in the .data section. The destination, in our case, is the general-purpose register eax, represented here with the notation %eax. Important note: the $ sign is used to indicate “immediate” operands. So constants and variables are preceded by this sign when operations are performed on them. This lets the compiler understand that these are not processor elements but values supplied directly to it. The % sign, on the other hand, is used as a prefix when using a register. The use of these two characters is specific to AT&T syntax. Intel syntax doesn't use these symbols for this purpose. So, back to the movl instruction. Here, $nbPommes is placed in the %eax register. In reality, it's the address where the nbPommes variable lives that is put in the %eax register.
The next instruction, addl, performs an addition. In this case, we add the decimal value 50 to whatever is at the address the %eax register points to. The parentheses around the %eax register name are used here as a dereference operator, a bit like the star in C programming. So the addition will not be done on what's in the %eax register, but on the memory address the %eax register points to. The following figure shows the relationship between the contents of the register and the memory cell the register points to at this point in the program.

If the dereference operator weren't used, the processor would have no way of knowing that we actually want to do the addition on the memory cell the EAX register points to. The operation would then be done directly on the EAX register itself, as shown in the following figure.
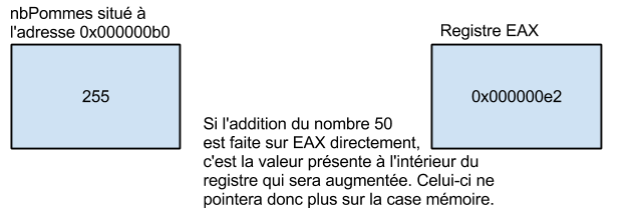
The link between the EAX register and the memory cell holding the value 255 would therefore be broken, since the register would no longer contain the address of the memory cell. If the memory cell being pointed to were dynamically allocated memory, the result would be a “memory leak”. So if you want to do the addition on the value stored in the memory cell the EAX register points to, it's important to use the dereference operators. The following figure shows the result of correctly performing the addition on the memory cell rather than on the register.
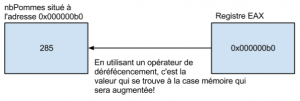
The last line of the program (not counting the last three...), incl (%eax), simply increments the value of the memory cell by 1. Note the use of the dereference operator.
So, as they say, our little program doesn't do much! But it has already let us learn and practice several important elements of assembly language. For C fans, the following figure shows a small C program that performs roughly the same operations. Note that the EAX register is represented by a variable of the same name, purely to help understand the example. This program is only shown to make it easier to understand and absorb assembly programming concepts.
C version
|
int nbPommes = 255; int *eax; int main(){ eax = &nbPommes; *eax = *eax + 50; *eax++; return 0; } |
So you can see that the assembly version of this little program is no more complicated than the C version of the application. You just need to get used to the somewhat unusual syntax of assembly languages. Once you're past that step, nothing in assembly is very complicated.
Now it's time to get our application running.
Translating into “opcodes” and “linking” the application
Before we can run the application we just wrote, there are two steps left. The first is to translate the assembly code into binary code the computer can understand. Then the resulting binary file has to be linked with any libraries that may have been used while developing the application. The following diagram summarizes these steps.
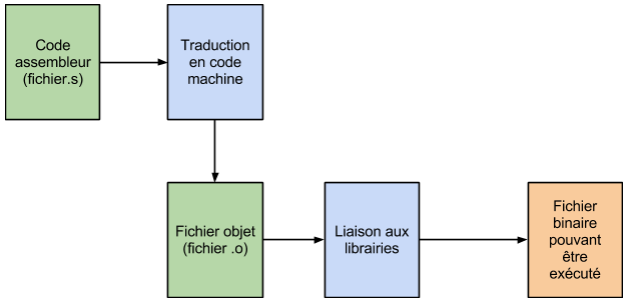 So, to get an application running after writing it, the programmer has to take two actions. These two actions boil down to two commands run on the command line. These two commands are shown in the following figure.
|
$ as -gstabs --32 functionPlay.s -o functionPlay.o $ ld -m elf_i386 functionPlay.o -o functionPlay |
These two commands prepare a 32-bit binary. For the first command, we used three options: the --32 option, the --gstab option and the -o option. The -gstabs option adds elements to the resulting file to make “debugging” the resulting application easier. The -o option simply specifies the name of the output file. The --32 option indicates that we want to build the application in 32-bit mode. As for the second command, the ld command, the -o option has the same effect as the -o option of the as command. As for the -m elf_i386 option, its purpose is to specify that we are working with a 32-bit file format. We'll come back to this command when we use C functions inside ASM applications.
After these two commands, the resulting file is ready to run! Or rather, to be debugged in our case ;)
Since our application doesn't display anything, we'll use the gdb debugger to make sure it works properly. Before going any further, make sure you have the latest version of gdb on your workstation. Some older versions have problems setting break points.
Basic gdb usage
To launch an application in gdb, just run the gdb command followed by the name of the binary file to debug. In my case, that gives the command shown in the following figure.
|
$ gdb movingDataProject |
After running this command, we land in the debugger environment. You can launch the application with the run command. The following figure shows our application running in gdb when the run command is issued.
|
(gdb) run Starting program: /home/philippe/Documents/PersonalProject/2013/ASM_Month/code/movingDataProject [Inferior 1 (process 3833) exited normally] (gdb) |
As you can see, not much happened! Since our application is very simple and there is no user interaction, gdb finished executing without really giving the programmer a chance to analyze how the application's code behaves. To be able to “see” our application running, we'll set break points in it. Break points let us pause the application so we can analyze its behaviour. These break points can be set on line numbers or on label names. You can also set conditional break points. In our case, we'll add a break point on the _start label. This will let us analyze our application from the very beginning of code execution. To add a break point, just use the break command. The following figure shows a break point being added on the _start label.
|
(gdb) break _start Breakpoint 1 at 0x4000b0: file movingDataProject.s, line 18. (gdb) |
Once the break point is added, we can start debugging our application. We'll launch the application with the run command. Pay close attention to the difference.
|
(gdb) run Starting program: /home/philippe/Documents/PersonalProject/2013/ASM_Month/code/movingDataProject Breakpoint 1, _start () at movingDataProject.s:18 18 movl $nbPommes, %eax (gdb) |
As you can see, the application is paused on our break point. The line of code displayed is the next line of code to be executed. At this point, we have two options to continue execution. We can either continue execution until the next break point with the continue command, or continue execution “line by line” with the next command. Since we have no other break point, we'll use the next command. But just before that, we'll look at the state of our processor's registers. You can display the registers with the info registers command. The following figure shows the result of running this command in my working environment.
|
(gdb) info registers rax 0x0 0 rbx 0x0 0 rcx 0x0 0 rdx 0x0 0 rsi 0x0 0 rdi 0x0 0 rbp 0x0 0x0 rsp 0x7fffffffe1f0 0x7fffffffe1f0 r8 0x0 0 r9 0x0 0 r10 0x0 0 r11 0x200 512 r12 0x0 0 r13 0x0 0 r14 0x0 0 r15 0x0 0 rip 0x4000b0 0x4000b0 <_start> eflags 0x202 [ IF ] cs 0x33 51 ss 0x2b 43 ds 0x0 0 es 0x0 0 fs 0x0 0 gs 0x0 0 (gdb) |
You'll probably notice that no register (other than the segment registers) has the same name as the registers we talked about in the previous article (this won't be the case if you used the 32-bit options when you generated the binary). Actually, this is perfectly normal, since I didn't build the code in 32-bit mode when I prepared the example. 64-bit registers are prefixed with the letter r rather than the letter e, which denotes 32-bit registers. So the eax register becomes rax when we're in 64-bit mode. In this case, the application will still work without any problem, but be careful, that won't always be the case. Also, before going further, gdb's print command will be very useful. This command displays a value, as shown in the following figure.
|
(gdb) print nbPommes $1 = 255 (gdb) |
So we can display the value of our variables from the debugger. Now we'll run the next command followed by the info registers command to see the result of executing our first line of code.
|
(gdb) next 19 addl $50, (%eax) (gdb) info registers rax 0x6000c8 6291656 rbx 0x0 0 rcx 0x0 0 rdx 0x0 0 rsi 0x0 0 rdi 0x0 0 rbp 0x0 0x0 rsp 0x7fffffffe1f0 0x7fffffffe1f0 r8 0x0 0 r9 0x0 0 r10 0x0 0 r11 0x200 512 r12 0x0 0 r13 0x0 0 r14 0x0 0 r15 0x0 0 rip 0x4000b5 0x4000b5 <_start+5> eflags 0x202 [ IF ] cs 0x33 51 ss 0x2b 43 ds 0x0 0 es 0x0 0 fs 0x0 0 gs 0x0 0 (gdb) |
As you can see, we moved forward by just one line. You can also see that the value of the eax (rax) register has changed. This register now points to the memory cell holding the nbPommes variable. The print nbPommes command can confirm that this variable's value is still 255.
|
(gdb) print nbPommes $2 = 255 (gdb) |
The next command to be executed is an addition; once again, we'll run the next command and display the state of the registers.
|
(gdb) next 20 incl (%eax) (gdb) info registers rax 0x6000c8 6291656 rbx 0x0 0 rcx 0x0 0 rdx 0x0 0 rsi 0x0 0 rdi 0x0 0 rbp 0x0 0x0 rsp 0x7fffffffe1f0 0x7fffffffe1f0 r8 0x0 0 r9 0x0 0 r10 0x0 0 r11 0x200 512 r12 0x0 0 r13 0x0 0 r14 0x0 0 r15 0x0 0 rip 0x4000b9 0x4000b9 <_start+9> eflags 0x212 [ AF IF ] cs 0x33 51 ss 0x2b 43 ds 0x0 0 es 0x0 0 fs 0x0 0 gs 0x0 0 (gdb) |
As you can see, we moved forward by one line. The value of the eax (rax) register didn't change. However, the print nbPommes command will show us that the addition was indeed performed, not on the eax register but on the data stored in the memory cell the eax register points to.
|
(gdb) print nbPommes $3 = 305 (gdb) |
What comes next should now be obvious to you! When you're done, you can run the continue command followed by the quit command to exit the debugger.
|
(gdb) continue Continuing. [Inferior 1 (process 3871) exited normally] (gdb) quit |
Note that it would have been possible to write the program so that we didn't have to work with the address holding the number of apples. The following figure shows another version of the application in which there is no need to use the dereference operator. You'll notice, however, that one extra operation is required to make the application work.
|
.section .data nbPommes: .int 255 .section .rodata .section .bss .section .text .globl _start _start: nop movl nbPommes, %eax addl $50, %eax movl %eax, nbPommes movl $1, %eax movl $0, %ebx int $0x80 |
Interpreting this new version is left as an exercise for you. With your newly acquired knowledge, you shouldn't have any trouble understanding what happens in this new version of the application.
And that wraps up the second article in this series! In the next article, we'll see how to control the execution flow of an assembly application. Until then, don't hesitate to contact us with any questions you may have!
PS: For those of you who'd like a gdb “cheat sheet”, here's one:
http://www.cs.berkeley.edu/~mavam/teaching/cs161-sp11/gdb-refcard.pdf